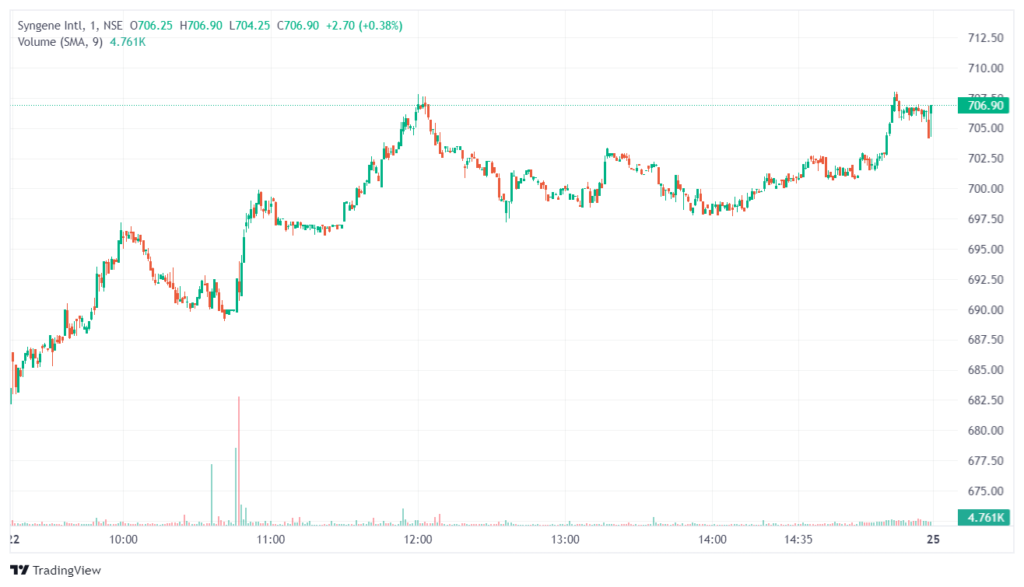
Syngine (NSE: SYNGINE), a mid-cap IT company providing system integration and technology services, has recently shown signs of a potential bullish breakout that could lead to decent upside for investors.
Our deep technical analysis reveals an opportune entry point that risk-savvy traders may look to capitalize on.
Double Bottom Formation Signals Potential Reversal
The Syngine stock has formed a solid double bottom pattern on its daily chart over the last couple of weeks. This reliable reversal indicator shows the stock price testing support around the ₹700 level twice recently, unable to break below it.
This signals the potential end of the prior downtrend, as buyers have stepped in firmly at this level. With a confirmation from other bullish indicators, this presents an opportunity to grab Syngine around current levels before a potential upside breakout.
Morning Star Pattern Adds to Bull Case
In addition to the double bottom, Syngine has also formed a bullish morning star pattern on its daily chart. The morning star usually signals the end of a downtrend, with the third candle closing significantly above the middle candle to show the bulls have regained control from the bears.

In Syngine’s case, this pattern formed with a gap up from the second candle’s close. With the stock not giving up much ground following this pattern, the conviction behind the signal is stronger.
Higher Volumes Provide Extra Confirmation
Critically, the rise from the double bottom lows and the morning star pattern itself has come on significantly higher trading volumes. Higher volumes add weightage and conviction to reversal signals, indicating increased participation from bulls.
The surge in volumes shows fresh money is getting pumped into Syngine stock, driving the emerging uptrend. From a trading perspective, this makes entering longs at current levels backed by strong signals from indicators quite appealing.
Oversold RSI Flashes Buy Signal
The Relative Strength Index (RSI), a leading momentum indicator, has also signaled positive tidings for Syngine’s stock.
The surge from the double bottom lows has taken the RSI from oversold territory below 30 to back above 50. This shows strengthening momentum behind the stock that is likely to fuel further upside.
Additionally, the RSI has seen a bullish crossover pattern, with the indicator line moving up above the signal line. This indicates momentum is turning favorable for the bull rally to continue.
Target Upside Levels – Where Can Syngine’s Stock Price Head?
If Syngine manages to post a convincing breakout above the double bottom neckline around ₹720 soon, it could mean the start of a decent rally targeting key upside levels.
The minimum target from this double bottom breakout comes to around ₹750. However, if bullish momentum accelerates heavily, the stock could also make a dash towards the next resistance around ₹765.
Advantageous Risk-Reward Scenario for Bull Traders
The bullish reversal signals combined with the RSI buy crossover makes this an attractive buy point for risk-savvy traders.
Entering Syngine stock around current levels with a stop loss below the critical support zone around ₹675 sets up a solid risk-reward play. The downside risk is capped at under 4% here, with upside potential of over 7% towards ₹750.
Adding on dips to lower the buying price while keeping in mind the stop loss allows traders to further tip the risk-reward favorably.
Conclusion – Technically Speaking, Syngine Stock Looks Ready for New Uptrend
Syngine’s stock has shown strong signs of bullish resurgence, with the double bottom and morning star patterns signaling an emerging uptrend. Indicators like rising volumes and an RSI crossover add to the buy case.
Risk management is key here despite the positive reversal signals. But the technical landscape does look inclined to fuel upside in Syngine after recent Corrective Declines.
The identified entry zone around ₹700, with targets at ₹750/765, offers an advantageous play for nimble bulls.
